Car Insurance Cost by State

The Full State-by-State Breakdown for 2026

Car insurance cost varies enormously by state, from about $1,148 a year in Wyoming up to about $4,296 a year in Louisiana for full coverage, a nearly fourfold difference for otherwise comparable drivers. The table below shows median monthly and annual rates for full coverage and minimum coverage in every state, based on a standardized 35-year-old driver profile with a clean record and good credit, so every row reflects the same comparison rather than mixing different assumptions.

Estimate Your Auto Insurance Cost

Use our free calculator to estimate potential costs based on age, vehicle type, and coverage level.

2026 State Cost Snapshot

Full 2026 State-by-State Cost Table

StateFull Coverage / MonthFull Coverage / YearMinimum / MonthMinimum / Year
Alabama$181$2,177$41$489
Alaska$137$1,648$32$383
Arizona$243$2,921$77$922
Arkansas$220$2,641$46$546
California$161$1,931$51$608
Colorado$268$3,210$62$748
Connecticut$232$2,789$84$1,008
Delaware$221$2,647$90$1,076
Florida$300$3,600$76$913
Georgia$261$3,136$87$1,043
Hawaii$166$1,998$50$603
Idaho$166$1,998$36$434
Illinois$215$2,578$64$764
Indiana$163$1,951$44$523
Iowa$186$2,228$33$397
Kansas$208$2,502$51$612
Kentucky$264$3,168$72$860
Louisiana$358$4,296$104$1,250
Maine$142$1,701$44$530
Maryland$251$3,016$92$1,105
Massachusetts$154$1,851$51$613
Michigan$253$3,034$57$688
Minnesota$212$2,549$54$650
Mississippi$208$2,499$49$591
Missouri$197$2,365$56$671
Montana$231$2,774$36$428
Nebraska$162$1,950$36$433
Nevada$286$3,428$85$1,019
New Hampshire$131$1,575$38$455
New Jersey$305$3,661$132$1,587
New Mexico$178$2,131$42$505
New York$223$2,676$86$1,027
North Carolina$149$1,789$50$598
North Dakota$202$2,423$37$448
Ohio$150$1,799$42$498
Oklahoma$183$2,191$40$477
Oregon$182$2,184$80$956
Pennsylvania$191$2,287$38$454
Rhode Island$259$3,107$69$825
South Carolina$191$2,288$54$649
South Dakota$184$2,212$32$383
Tennessee$178$2,130$43$521
Texas$297$3,560$90$1,078
Utah$193$2,317$75$896
Vermont$122$1,464$36$429
Virginia$180$2,165$66$786
Washington$193$2,321$56$667
Washington, D.C.$221$2,655$74$892
West Virginia$179$2,149$56$672
Wisconsin$193$2,315$46$553
Wyoming$96$1,148$16$192

National average: $2,356 a year for full coverage, $646 a year for minimum coverage, based on this same dataset. Your actual premium will differ from these medians based on your age, driving history, vehicle, ZIP code, coverage limits, and insurer, use our Auto Insurance Calculator for a personalized estimate rather than relying on the state median alone. Looking for a national breakdown rather than state-by-state rates? See how much car insurance costs per month.

Kevin Brooks
Insurance Research Analyst
Kevin Brooks covers insurance pricing and cost research at InsuranceBlip. His work analyzes the rating factors insurers use, including driving history, location, credit score, and vehicle type, helping readers understand why they pay what they pay and how to pay less.

Browse Insurance Guides

Insurance Basics Guides
Insurance Cost Guides
Insurance Comparison Guides
Insurance Coverage Guides

Insights From Recent Articles

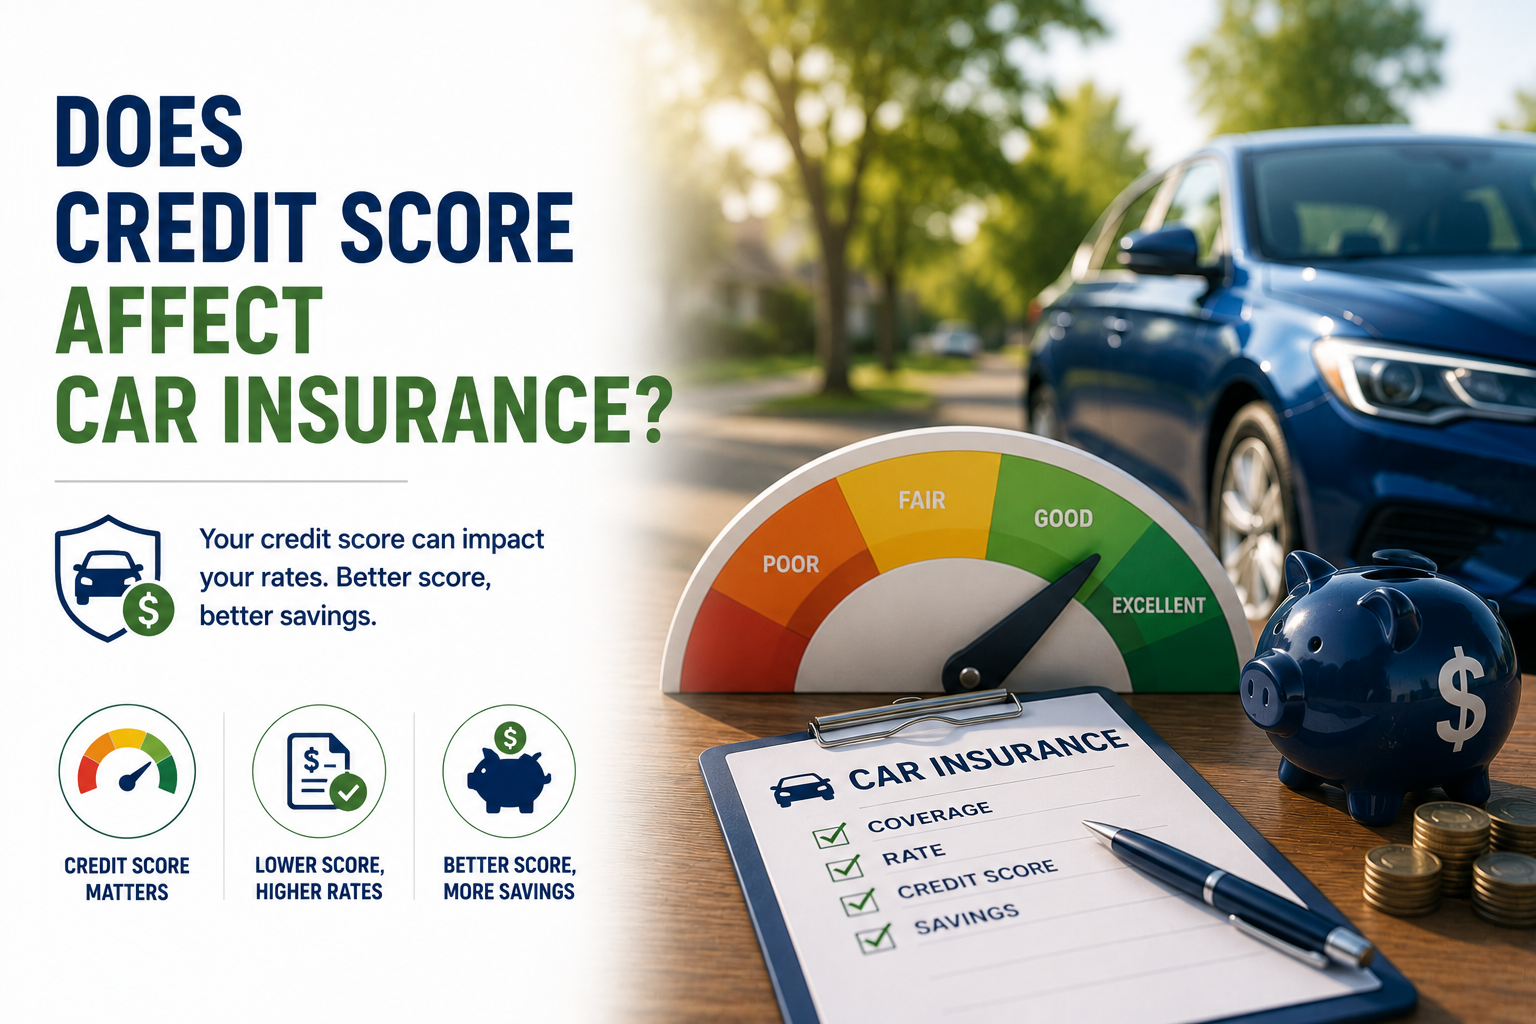
Does Credit Score Affect Your Car Insurance Rate
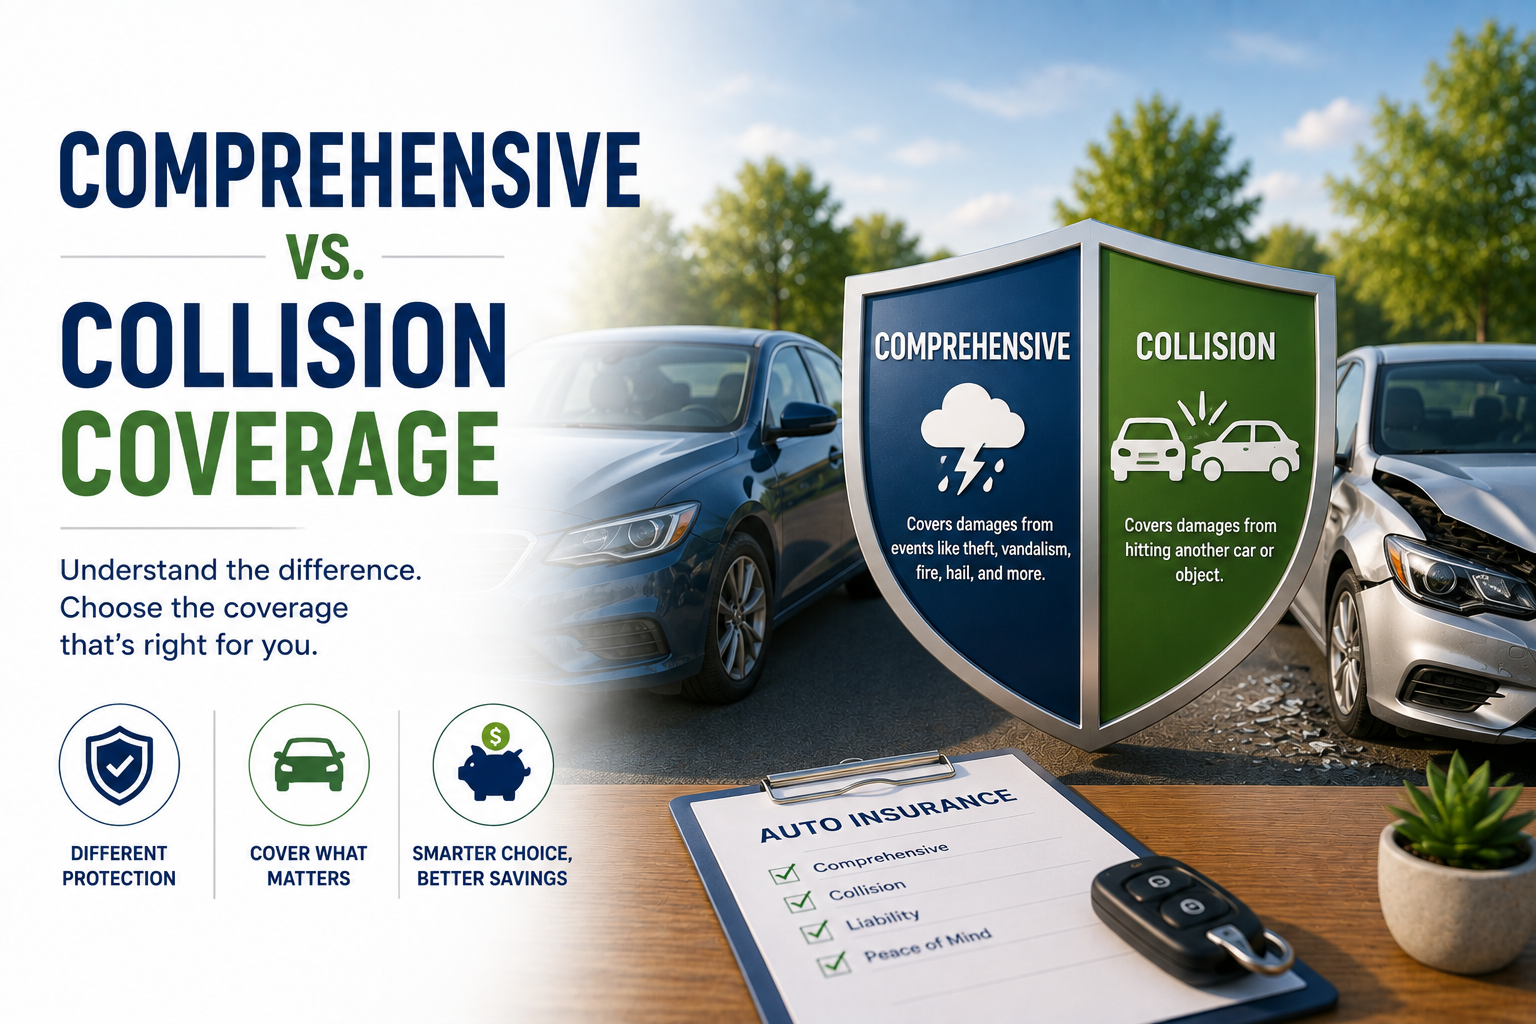
Comprehensive vs Collision Coverage
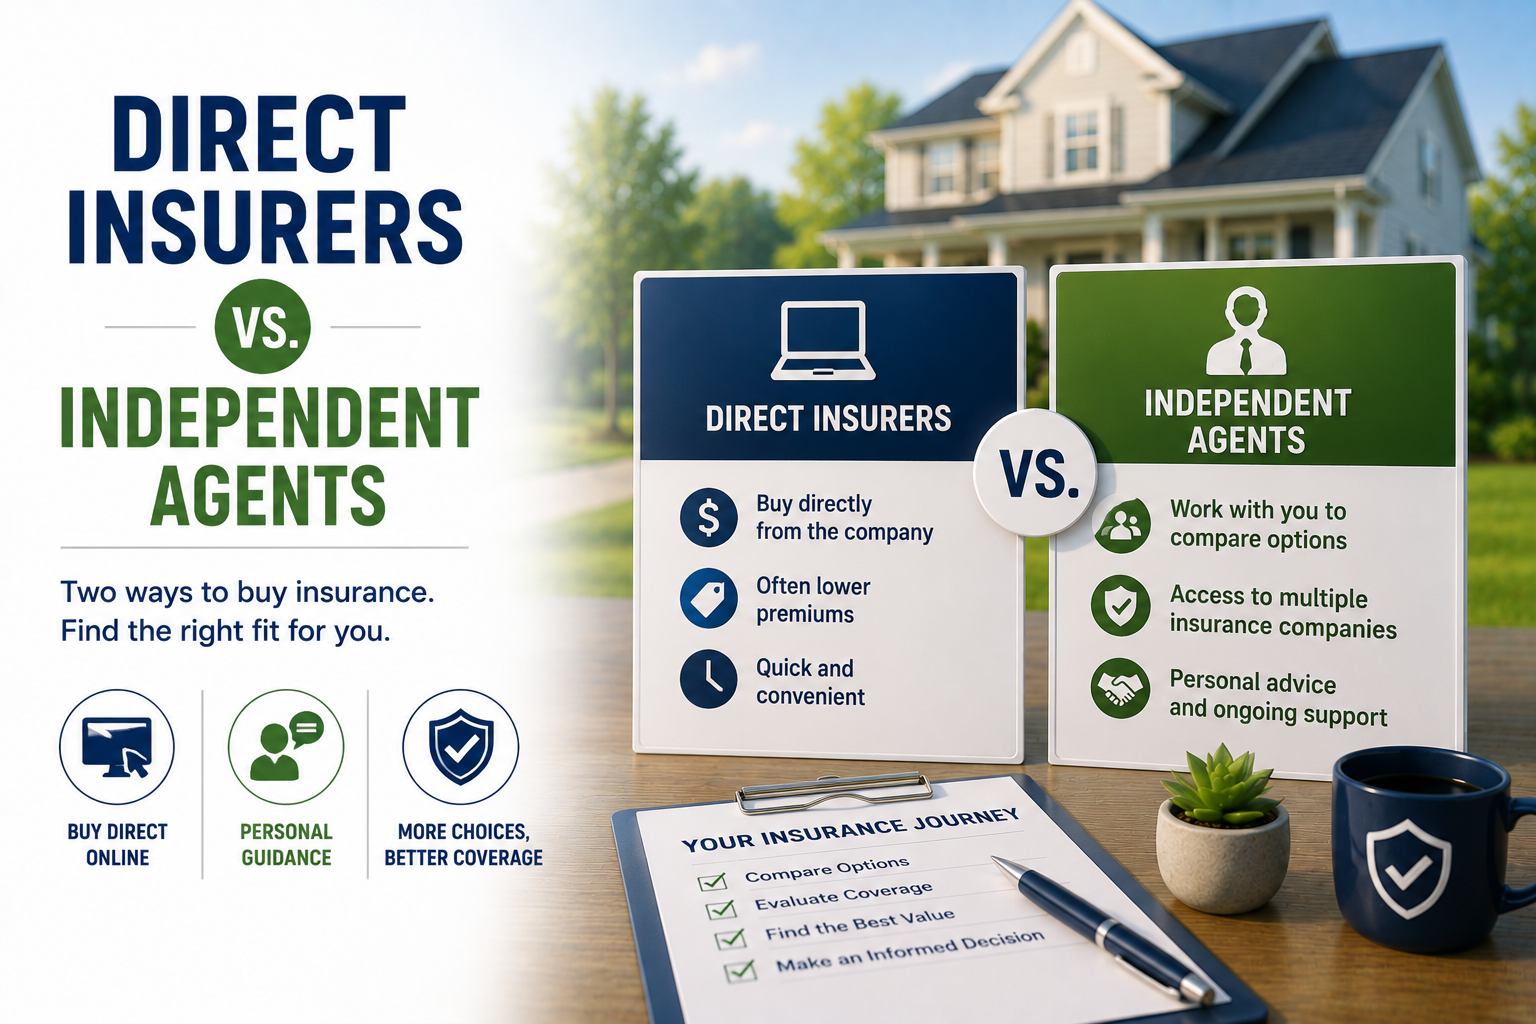
Direct Insurers vs Independent Agents
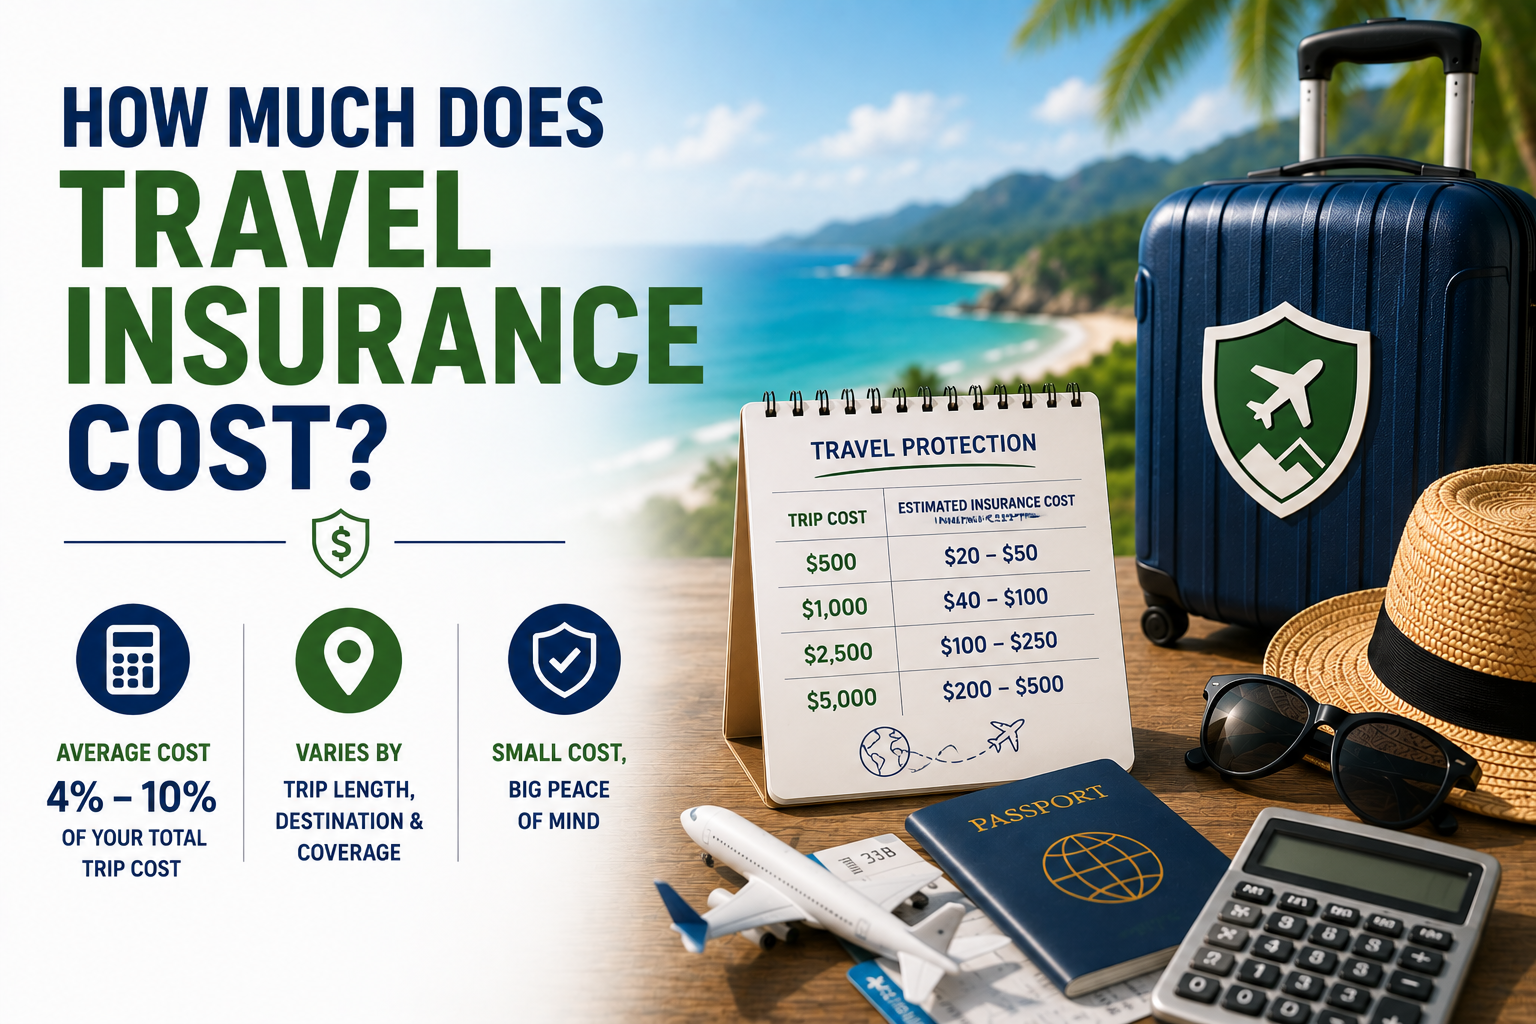
How Much Does Travel Insurance Cost
Does Auto Insurance Cover Rental Cars

Explore By Insurance Types

Auto Insurance
Business Insurance
Health Insurance
Home Insurance
Life Insurance
Travel Insurance

Most Expensive States for Car Insurance

Industry analysts commonly point to shared risk factors across these states: dense urban traffic, higher litigation costs, elevated uninsured motorist rates, or significant weather exposure, often several factors together. These are widely cited explanations rather than conclusions this specific cost dataset independently establishes.

Cheapest States for Car Insurance

These states are commonly associated with the opposite pattern: lower population density, lower accident frequency, and a less litigation-heavy claims environment.

Why Car Insurance Costs Vary by State

Two separate factors drive the difference: the minimum coverage a state legally requires, and the actual risk factors present there, including weather, litigation environment, population density, and accident frequency. A state with low minimum requirements doesn't automatically mean low real premiums, and a state with high minimums doesn't automatically mean expensive coverage, the two interact but aren't the same thing.

Industry sources commonly attribute the Gulf Coast and Southeastern states' consistently high rankings, particularly Louisiana and Florida, to hurricane and flood exposure affecting comprehensive claims, a more litigation-heavy claims environment, and higher uninsured driver rates. Rural New England and Mountain West states, particularly Vermont, Maine, New Hampshire, and Wyoming, are commonly associated with the opposite pattern, reflecting lower population density and lower accident frequency.

State Minimum Requirements: Key Examples

Beyond the cost table above, what you're legally required to carry also varies by state. Here are the examples with the clearest documentation and strongest current verification.

State Requirement What Makes It Notable
Florida $10,000 PIP, $10,000 property damage, no bodily injury required Most unusual structure in the country, changing entirely January 1, 2027
Texas 30/60/25, PIP optional Higher bodily injury minimum than all four neighboring states, unchanged since 2011
Virginia 50/100/25 (raised from 30/60/20, effective for policies on or after January 1, 2025) Eliminated its uninsured motor vehicle fee option effective July 1, 2024; all registered vehicles now require insurance
New Hampshire No blanket mandatory insurance law Still requires proof of financial responsibility. A 2026 bill, HB1558, would require proof of insurance at vehicle registration starting January 1, 2027, if enacted; as of current sources, this remains a pending bill, not current law
Louisiana 15/30/25 Among the lowest bodily injury minimums of any state with traditional liability requirements
Alaska, Maine 50/100 bodily injury Roughly double what most states require
Michigan 50/100 plus tiered PIP starting at $50,000 One of the more comprehensive no-fault minimum structures
Hawaii 40/80/20 (raised from 20/40/10 in 2026) One of several states that increased minimums in 2026
New Jersey 35/70/25 (raised from 25/50/25 in 2026) Another 2026 increase, alongside corresponding UM/UIM limit changes

For your specific state's current exact requirements, verify directly with your state's Department of Insurance or DMV. Requirements change through state legislation, and several states have adjusted their minimums within the past year alone.

Florida's 2027 Shift to At-Fault

This is worth understanding now if you drive in Florida. Florida has long operated under an unusual no-fault structure: ten thousand dollars in personal injury protection and ten thousand dollars in property damage liability, with no bodily injury liability required at all.

Starting January 1, 2027, Florida is scheduled to transition away from its no-fault system entirely, moving to an at-fault structure with new bodily injury and property damage requirements. This is a structural change to how the entire state handles claims, not a minor limit adjustment, and it will likely affect how premiums are calculated going forward. Florida drivers should watch for updated official requirements as this date approaches, and this specific transition is worth verifying again closer to publish date and periodically afterward, since the exact enacted requirements were not yet finalized in all published sources as of this writing.

How Moving to Another State Can Change Your Premium

Relocating can shift your premium significantly even with an identical driving record. A driver moving from Vermont ($1,464/year median) to Louisiana ($4,296/year median) would see their premium roughly triple for comparable coverage, purely from the change in location. Moving between states can also change the minimum coverage you're legally required to carry, so your insurer will generally need to rewrite or update your policy after you establish residency in the new state.

Methodology and Sources

The full state table above is sourced from a single, consistent methodology (NerdWallet's August 2026 analysis, based on median rates from Quadrant Information Services across all 50 states and Washington D.C., using a standardized 35-year-old driver profile with good credit, a clean driving record, and consistent coverage limits) rather than combined from multiple sources with different assumptions, so every row is directly comparable to every other row.

Other reputable sources, including Insurify, ValuePenguin, and Experian, publish their own 2026 estimates using different driver profiles and data collection periods, and their specific dollar figures differ somewhat from the table above as a result. What's consistent across nearly every source, regardless of exact methodology, is the directional pattern: Louisiana, Florida, and New Jersey or Maryland appear among the most expensive states, while Vermont, Maine, and Wyoming appear among the cheapest, that convergence across independently-run analyses is a genuinely reliable signal even where the precise dollar amounts vary.


Cost data last reviewed: August 2026. State insurance requirement data last reviewed: August 2026. Both cost figures and state requirements change periodically, this page should be revisited and reverified on a 6 to 12 month cycle.

Frequently Asked Questions

Why is car insurance more expensive in some states than others?

A combination of legal minimum requirements, regional risk factors like weather and accident frequency, the local litigation environment, and the rate of uninsured drivers all contribute. No single factor explains the full difference.

Which states have the cheapest car insurance?

Wyoming, Vermont, New Hampshire, Alaska, and Maine currently have the lowest median full coverage rates, according to this data, generally reflecting lower population density and lower accident frequency in these largely rural states.

Which states have the most expensive car insurance?

Louisiana, New Jersey, Florida, Texas, and Nevada currently have the highest median full coverage rates, according to this data, though the exact ranking order shifts somewhat depending on the specific source and year.

How was this cost data collected?

The table on this page reflects median rates compiled by NerdWallet using data from Quadrant Information Services, based on a standardized driver profile applied consistently across all 50 states and Washington D.C. This approach keeps every state’s figure directly comparable, rather than mixing figures calculated under different assumptions.

A Real Range, Not a Single National Number

Car insurance cost by state comes down to two related questions: what your state legally requires, and what your state's real risk factors actually cost to insure against. The nearly fourfold gap between Wyoming and Louisiana shows how much location alone can move your premium, often more than any personal factor you control. Confirm your specific state's current requirements directly with your Department of Insurance, and use the calculator below for an estimate based on your own profile rather than the state median alone.

See What You'd Actually Pay in Your State

Get a personalized estimate based on your specific state, driving profile, and coverage needs.

Try Auto Insurance CalculatorExplore Insurance Guides

At A Galance

Insurance Tools & Estimators

Use our free tools to estimate insurance costs before you shop. No personal information required just straight forward estimates.

Auto Insurance Calculator

Estimate your car insurance costs based on your age range, driving history, vehicle type, coverage level, & location. Understand how each factor affects your premium.

Life Insurance Needs Calculator

Calculate how much life insurance coverage your family might need based on your income, debts, and financial goals.

Health Insurance Estimator

Understand how premiums, deductible, out-of-pocket costs vary across different plans. Useful for comparing coverage options during enrollment or life change.

Business Insurance Estimator

Estimate general liability and small business insurance costs based on your industry, business size, and coverage needs.

Homeowners Insurance Calculator

Estimate how much homeowners insurance might cost based on your property value, location, and coverage needs.

Travel Insurance Calculator

Estimate trip protection costs based on your destination, trip duration, and the type of coverage you need.